
Cloudflare Mesh is now available (blog post ↗). Mesh connects your services and devices with post-quantum encrypted networking, allowing you to route traffic privately between servers, laptops, and phones over TCP, UDP, and ICMP.

- Assigns a private Mesh IP to every enrolled device and node.
- Enables any participant to reach any other participant by IP — including client-to-client, without deploying any infrastructure.
- Supports CIDR routes for subnet routing through Mesh nodes.
- Supports high availability with active-passive replicas for nodes with routes.
- All traffic flows through Cloudflare, so Gateway network policies, device posture checks, and access rules apply to every connection.
- WARP Connector is now Cloudflare Mesh. Existing WARP Connectors are now called mesh nodes. All existing deployments continue to work — no migration required.
- Peer-to-peer connectivity is now called Mesh connectivity and is part of the Cloudflare Mesh documentation.
- Mesh node limit increased from 10 to 50 per account.
- New dashboard experience ↗ at Networking > Mesh with an interactive network map, node management, route configuration, diagnostics, and a setup wizard.
Refer to the Cloudflare Mesh documentation to set up your first Mesh network.
The Credentials and Secrets DLP profile now includes three new predefined entries for detecting Cloudflare API credentials:
Entry name Token prefix Detects Cloudflare User API Key cfk_User-scoped API keys Cloudflare User API Token cfut_User-scoped API tokens Cloudflare Account Owned API Token cfat_Account-scoped API tokens These detections target the new Cloudflare API credential format, which uses a structured prefix and a CRC32 checksum suffix. The identifiable prefix makes it possible to detect leaked credentials with high confidence and low false positive rates — no surrounding context such as
Authorization: Bearerheaders is required.Credentials generated before this format change will not be matched by these entries.
- In the Cloudflare dashboard ↗, go to Zero Trust > DLP > DLP Profiles.
- Select the Credentials and Secrets profile.
- Turn on one or more of the new Cloudflare API token entries.
- Use the profile in a Gateway HTTP policy to log or block traffic containing these credentials.
Example policy:
Selector Operator Value Action DLP Profile in Credentials and Secrets Block You can also enable individual entries to scope detection to specific credential types — for example, enabling Account Owned API Token detection without enabling User API Key detection.
For more information, refer to predefined DLP profiles.
You can now configure how sensitive data matches are displayed in your DLP payload match logs — giving your incident response team the context they need to validate alerts without compromising your security posture.
To get started, go to the Cloudflare dashboard ↗, select Zero Trust > Data loss prevention > DLP settings and find the Payload log masking card.
Previously, all DLP payload logs used a single masking mode that obscured matched data entirely and hid the original character count, making it difficult to distinguish true positives from false positives. This update introduces three options:
- Full Mask (default): Masks the match while preserving character count and visual formatting (for example,
***-**-****for a Social Security Number). This is an improvement over the previous default, which did not preserve character count. - Partial Mask: Reveals 25% of the matched content while masking the remainder (for example,
***-**-6789). - Clear Text: Stores the full, unmasked violation for deep investigation (for example,
123-45-6789).
Important: The masking level you select is applied at detection time, before the payload is encrypted. This means the chosen format is what your team will see after decrypting the log with your private key — the existing encryption workflow is unchanged.
Applies to all enabled detections: When a masking level other than Full Mask is selected, it applies to all sensitive data matches found within a payload window — not just the match that triggered the policy. Any data matched by your enabled DLP detection entries will be masked at the selected level.
For more information, refer to DLP logging options.
- Full Mask (default): Masks the match while preserving character count and visual formatting (for example,
OAuth allows third-party applications to access your Cloudflare account on your behalf — like when Wrangler deploys Workers or when monitoring tools read your analytics. You now have granular control over which accounts these applications can access, plus the ability to revoke access anytime.
When authorizing an OAuth application, you can now select specific accounts instead of granting access to all your accounts:
- Account-by-account selection — Choose exactly which accounts the application can access
- "All accounts" option — Still available for trusted tools like Wrangler This gives you precise control who can access your data.
The OAuth consent screen now shows:
- What the application can access — Explicit list of permissions being requested
- Who created the application — Application owner and contact information
- Which accounts you're authorizing — Checkboxes for account selection
Manage authorized OAuth applications from your profile:
- See all connected apps — View every OAuth application with access to your accounts
- Review permissions and scope — Check what each application can do and which accounts it can access
- Revoke instantly — Remove access with one click when you no longer need it To manage your OAuth applications, navigate to Profile > Access Management > Connected Applications ↗.
These updates give you:
- Granular control — Authorize apps per-account instead of all-or-nothing
- Transparency — Know exactly what you're authorizing before you consent
- Security — Limit blast radius by restricting access to only necessary accounts
- Easy cleanup — Revoke access when applications are no longer needed
Read more about these improvements in our blog post: Improving the OAuth consent experience ↗.
You can now configure Logpush jobs to Google BigQuery directly from the Cloudflare dashboard, in addition to the existing API-based setup.
Previously, setting up a BigQuery Logpush destination required using the Logpush API. Now you can create and manage BigQuery Logpush jobs from the Logpush page in the Cloudflare dashboard by selecting Google BigQuery as the destination and entering your Google Cloud project ID, dataset ID, table ID, and service account credentials.
For more information, refer to Enable Logpush to Google BigQuery.
Radar shareable widgets now include a generate citation action, making it easier to reference Cloudflare Radar ↗ data in research papers and other publications.
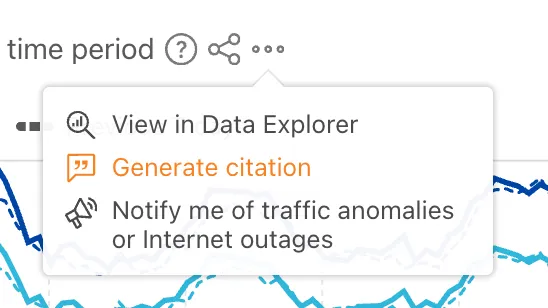
Select the citation icon to open a modal with five supported citation styles:
- BibTeX
- APA
- MLA
- Chicago
- RIS
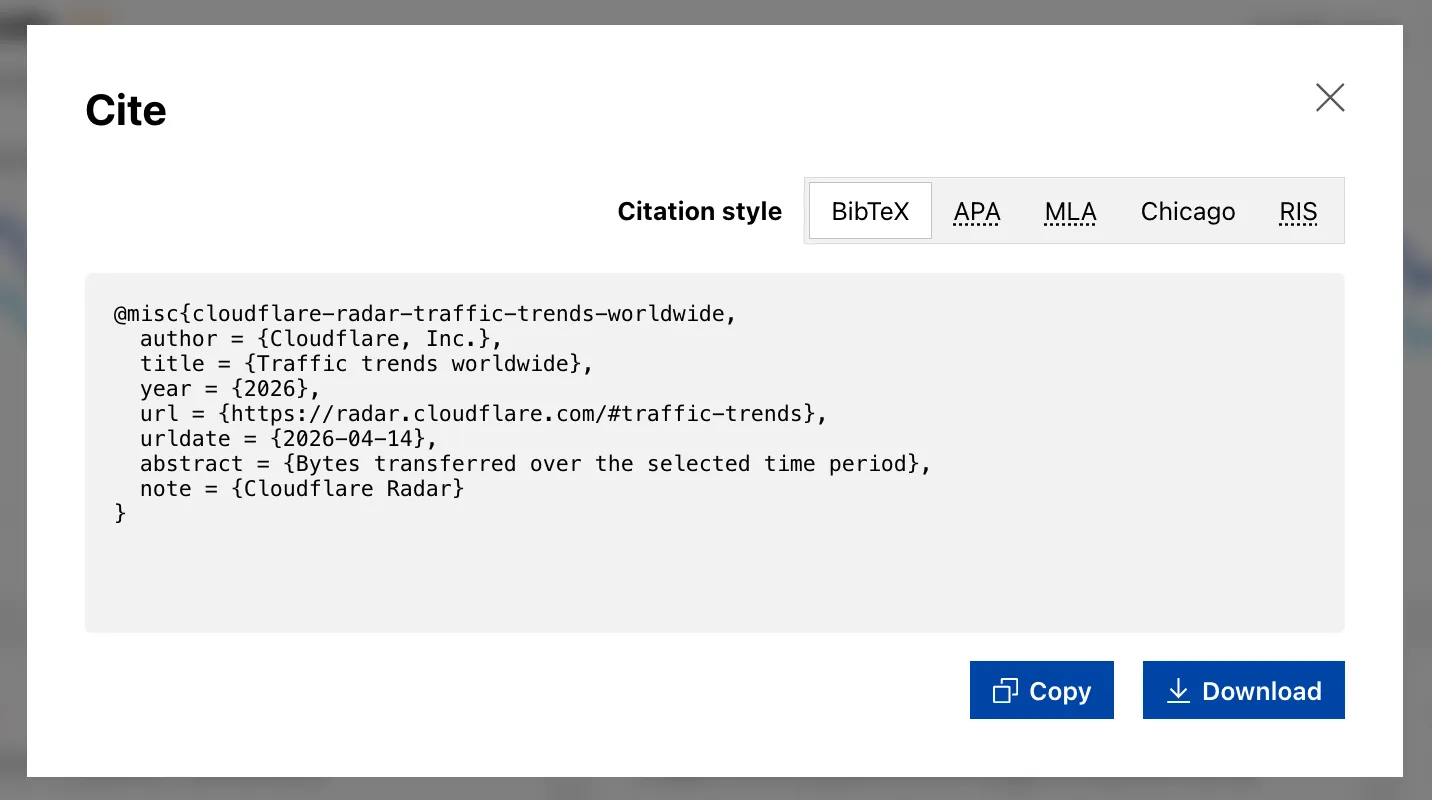
Explore the feature on any shareable widget at Cloudflare Radar ↗.
The decode script injected by Email Address Obfuscation now loads with the
deferattribute. This means the script no longer blocks page rendering. It downloads in parallel with HTML parsing and executes after the document is fully parsed, before theDOMContentLoadedevent.This improves page loading performance, contributing to better Core Web Vitals, for all zones with Email Address Obfuscation on. No action is required.
If you have custom JavaScript that depends on email addresses being decoded at a specific point during page load, note that the decode script now executes after HTML parsing completes rather than inline during parsing.
VPC Network bindings now give your Workers access to any service in your private network without pre-registering individual hosts or ports. This complements existing VPC Service bindings, which scope each binding to a specific host and port.
You can bind to a Cloudflare Tunnel by
tunnel_idto reach any service on the network where that tunnel is running, or bind to your Cloudflare Mesh network usingcf1:networkto reach any Mesh node, client device, or subnet route in your account:JSONC {"vpc_networks": [{"binding": "MESH","network_id": "cf1:network","remote": true}]}TOML [[vpc_networks]]binding = "MESH"network_id = "cf1:network"remote = trueAt runtime,
fetch()routes through the network to reach the service at the IP and port you specify:JavaScript const response = await env.MESH.fetch("http://10.0.1.50:8080/api/data");For configuration options and examples, refer to VPC Networks and Connect Workers to Cloudflare Mesh.
Cloudflare Containers and Sandboxes are now generally available.
Containers let you run more workloads on the Workers platform, including resource-intensive applications, different languages, and CLI tools that need full Linux environments.
Since the initial launch of Containers, there have been significant improvements to Containers' performance, stability, and feature set. Some highlights include:
- Higher limits allow you to run thousands of containers concurrently.
- Active-CPU pricing means that you only pay for used CPU cycles.
- Easy connections to Workers and other bindings via hostnames help you extend your Containers with additional functionality.
- Docker Hub support makes it easy to use your existing images and registries.
- SSH support helps you access and debug issues in live containers.
The Sandbox SDK provides isolated environments for running untrusted code securely, with a simple TypeScript API for executing commands, managing files, and exposing services. This makes it easier to secure and manage your agents at scale. Some additions since launch include:
- Live preview URLs so agents can run long-lived services and verify in-flight changes.
- Persistent code interpreters for Python, JavaScript, and TypeScript, with rich structured outputs.
- Interactive PTY terminals for real browser-based terminal access with multiple isolated shells per sandbox.
- Backup and restore APIs to snapshot a workspace and quickly restore an agent's coding session without repeating expensive setup steps.
- Real-time filesystem watching so apps and agents can react immediately to file changes inside a sandbox.
For more information, refer to Containers and Sandbox SDK documentation.
Outbound Workers for Sandboxes and Containers now support zero-trust credential injection, TLS interception, allow/deny lists, and dynamic per-instance egress policies. These features give platforms running agentic workloads full control over what leaves the sandbox, without exposing secrets to untrusted workloads, like user-generated code or coding agents.
Because outbound handlers run in the Workers runtime, outside the sandbox, they can hold secrets the sandbox never sees. A sandboxed workload can make a plain request, and credentials are transparently attached before a request is forwarded upstream.
For instance, you could run an agent in a sandbox and ensure that any requests it makes to Github are authenticated. But it will never be able to access the credentials:
TypeScript export class MySandbox extends Sandbox {}MySandbox.outboundByHost = {"github.com": (request: Request, env: Env, ctx: OutboundHandlerContext) => {const requestWithAuth = new Request(request);requestWithAuth.headers.set("x-auth-token", env.SECRET);return fetch(requestWithAuth);},};You can easily inject unique credentials for different instances by using
ctx.containerId:TypeScript MySandbox.outboundByHost = {"my-internal-vcs.dev": async (request: Request,env: Env,ctx: OutboundHandlerContext,) => {const authKey = await env.KEYS.get(ctx.containerId);const requestWithAuth = new Request(request);requestWithAuth.headers.set("x-auth-token", authKey);return fetch(requestWithAuth);},};No token is ever passed into the sandbox. You can rotate secrets in the Worker environment and every request will pick them up immediately.
Outbound Workers now intercept HTTPS traffic. A unique ephemeral certificate authority (CA) and private key are created for each sandbox instance. The CA is placed into the sandbox and trusted by default. The ephemeral private key never leaves the container runtime sidecar process and is never shared across instances.
With TLS interception active, outbound Workers can act as a transparent proxy for both HTTP and HTTPS traffic.
Easily filter outbound traffic with
allowedHostsanddeniedHosts. WhenallowedHostsis set, it becomes a deny-by-default allowlist. Both properties support glob patterns.TypeScript export class MySandbox extends Sandbox {allowedHosts = ["github.com", "npmjs.org"];}Define named outbound handlers then apply or remove them at runtime using
setOutboundHandler()orsetOutboundByHost(). This lets you change egress policy for a running sandbox without restarting it.TypeScript export class MySandbox extends Sandbox {}MySandbox.outboundHandlers = {allowHosts: async (req: Request, env: Env, ctx: OutboundHandlerContext ) => {const url = new URL(req.url);if (ctx.params.allowedHostnames.includes(url.hostname)) {return fetch(req);}return new Response(null, { status: 403 });},noHttp: async () => {return new Response(null, { status: 403 });},};Apply handlers programmatically from your Worker:
TypeScript const sandbox = getSandbox(env.Sandbox, userId);// Open network for setupawait sandbox.setOutboundHandler("allowHosts", {allowedHostnames: ["github.com", "npmjs.org"],});await sandbox.exec("npm install");// Lock down after setupawait sandbox.setOutboundHandler("noHttp");Handlers accept
params, so you can customize behavior per instance without defining separate handler functions.Upgrade to
@cloudflare/containers@0.3.0or@cloudflare/sandbox@0.8.9to use these features.For more details, refer to Sandbox outbound traffic and Container outbound traffic.
Local Explorer is a browser-based interface and REST API for viewing and editing local resource data during development. It removes the need to write throwaway scripts or dig through
.wrangler/stateto understand what data your Worker has stored locally.Local Explorer is available in Wrangler 4.82.1+ and the Cloudflare Vite plugin 1.32.0+. Start a local development session and press
ein your terminal, or navigate to/cdn-cgi/exploreron your local dev server.Local Explorer supports five resource types and works across multiple workers running locally:
- KV — Browse keys, view values and metadata, create, update, and delete key-value pairs.
- R2 — List objects, view metadata, upload files, and delete objects. Supports directory views and multi-select.
- D1 — Browse tables and rows, run arbitrary SQL queries, and edit schemas in a full data studio.
- Durable Objects (SQLite storage) — Browse individual object SQLite tables, run SQL queries, and edit schemas.
- Workflows — List instances, view status and step history, trigger new runs, and pause, resume, restart, or terminate instances.
Local Explorer exposes a REST API at
/cdn-cgi/explorer/apithat provides programmatic access to the same operations available in the browser. The root endpoint returns an OpenAPI specification ↗ describing all available endpoints, parameters, and response formats.Terminal window curl http://localhost:8787/cdn-cgi/explorer/apiPoint an AI coding agent at
/cdn-cgi/explorer/apiand it can discover and interact with your local resources without manual setup. This enables iterative development loops where an agent can populate test data in KV or D1, inspect Durable Object state, trigger Workflow runs, or upload files to R2.For more details, refer to the Local Explorer documentation.
Remote Browser Isolation now supports Canvas Remoting, improving performance for HTML5 Canvas applications by sending vector draw commands instead of rasterized bitmaps.
- 10x bandwidth reduction: Microsoft Word and other Office apps use 90% less bandwidth
- Smooth performance: Google Sheets maintains consistent 30fps rendering
- Responsive terminals: Web-based development environments and AI notebooks work in real-time
- Zero configuration: Enabled by default for all Browser Isolation customers
Instead of sending rasterized bitmaps for every Canvas update, Browser Isolation now:
- Captures Canvas draw commands at the source
- Converts them to lightweight vector instructions
- Renders Canvas content on the client
This reduces bandwidth from hundreds of kilobytes per second to tens of kilobytes per second.
To temporarily disable for troubleshooting:
- Right-click the isolated webpage background
- Select Disable Canvas Remoting
- Re-enable the same way by selecting Enable Canvas Remoting
Currently supports 2D Canvas contexts only. WebGL and 3D graphics applications continue using bitmap rendering. For more information, refer to Canvas Remoting.
Browser Rendering now exposes the Chrome DevTools Protocol (CDP), the low-level protocol that powers browser automation. The growing ecosystem of CDP-based agent tools, along with existing CDP automation scripts, can now use Browser Rendering directly.
Any CDP-compatible client, including Puppeteer and Playwright, can connect from any environment, whether that is Cloudflare Workers, your local machine, or a cloud environment. All you need is your Cloudflare API key.
For any existing CDP script, switching to Browser Rendering is a one-line change:
JavaScript const puppeteer = require("puppeteer-core");const browser = await puppeteer.connect({browserWSEndpoint: `wss://api.cloudflare.com/client/v4/accounts/${ACCOUNT_ID}/browser-rendering/devtools/browser?keep_alive=600000`,headers: { Authorization: `Bearer ${API_TOKEN}` },});const page = await browser.newPage();await page.goto("https://example.com");console.log(await page.title());await browser.close();Additionally, MCP clients like Claude Desktop, Claude Code, Cursor, and OpenCode can now use Browser Rendering as their remote browser via the chrome-devtools-mcp ↗ package.
Here is an example of how to configure Browser Rendering for Claude Desktop:
{"mcpServers": {"browser-rendering": {"command": "npx","args": ["-y","chrome-devtools-mcp@latest","--wsEndpoint=wss://api.cloudflare.com/client/v4/accounts/<ACCOUNT_ID>/browser-rendering/devtools/browser?keep_alive=600000","--wsHeaders={\"Authorization\":\"Bearer <API_TOKEN>\"}"]}}}To get started, refer to the CDP documentation.
Cloudflare API tokens now include identifiable patterns that enable secret scanning tools to automatically detect them when leaked in code repositories, configuration files, or other public locations.
API tokens generated by Cloudflare now follow a standardized format that secret scanning tools can recognize. When a Cloudflare token is accidentally committed to GitHub, GitLab, or another platform with secret scanning enabled, the tool will flag it and alert you.
Leaked credentials are a common security risk. By making Cloudflare tokens detectable by scanning tools, you can:
- Detect leaks faster — Get notified immediately when a token is exposed.
- Reduce risk window — Exposed tokens are deactivated immediately, before they can be exploited.
- Automate security — Leverage existing secret scanning infrastructure without additional configuration.
When a third-party secret scanning tool detects a leaked Cloudflare API token:
- Cloudflare immediately deactivates the token to prevent unauthorized access.
- The token creator receives an email notification alerting them to the leak.
- The token is marked as "Exposed" in the Cloudflare dashboard.
- You can then roll or delete the token from the token management pages.
- GitHub Secret Scanning — Automatically enabled for public repositories
For more information on token formats and secret scanning, refer to API token formats.
You can now use CASB webhooks in Cloudflare One to send posture finding instances to external systems such as chat platforms, ticketing systems, SIEMs, SOAR tools, and custom automation services.
This gives security teams a simple way to route CASB posture findings into the tools and workflows they already use for triage and response.
To get started, go to Integrations > Webhooks in the Cloudflare One dashboard to create a webhook destination. After you configure a webhook, open a posture finding instance and select Send webhook to send it.
- Flexible authentication — Configure destinations using None, Basic Auth, Bearer Auth, Static Headers, or HMAC-Signing.
- Built-in testing — Use Test delivery to send a test request before sending a live finding instance.
- Posture finding workflows — Send posture finding instances directly from the finding details workflow in Cloud & SaaS findings.
- HTTPS destinations — Configure webhook destinations with public
https://URLs.
- Configure CASB webhooks in Cloudflare.
- Learn how to manage findings in Cloudflare.
CASB webhooks are now available in Cloudflare One.
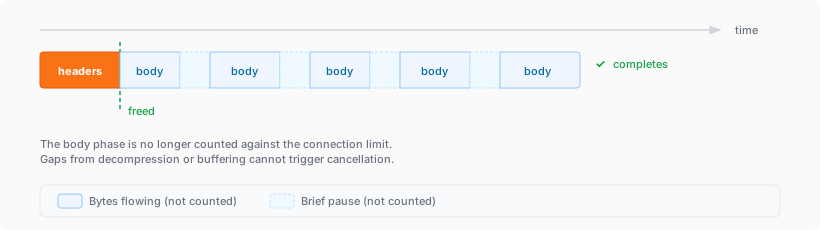
The simultaneous open connections limit has been relaxed. Previously, each Worker invocation was limited to six open connections at a time for the entire lifetime of each connection, including while reading the response body. Now, a connection is freed as soon as response headers arrive, so the six-connection limit only constrains how many connections can be in the initial "waiting for headers" phase simultaneously.
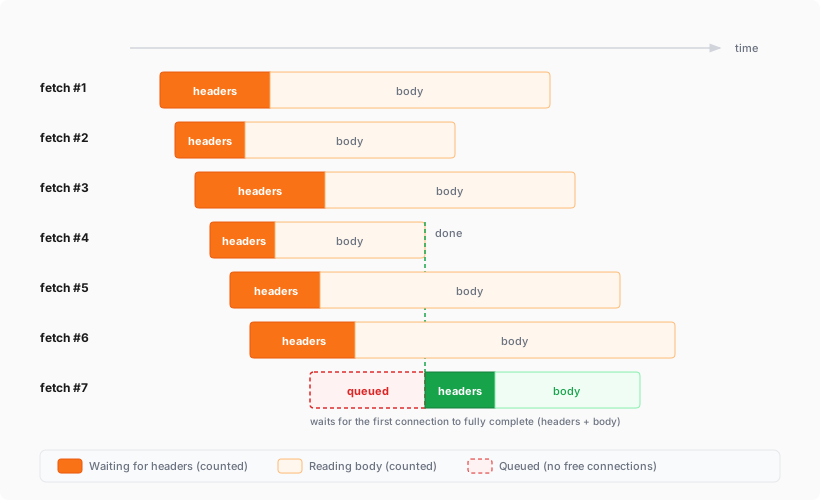
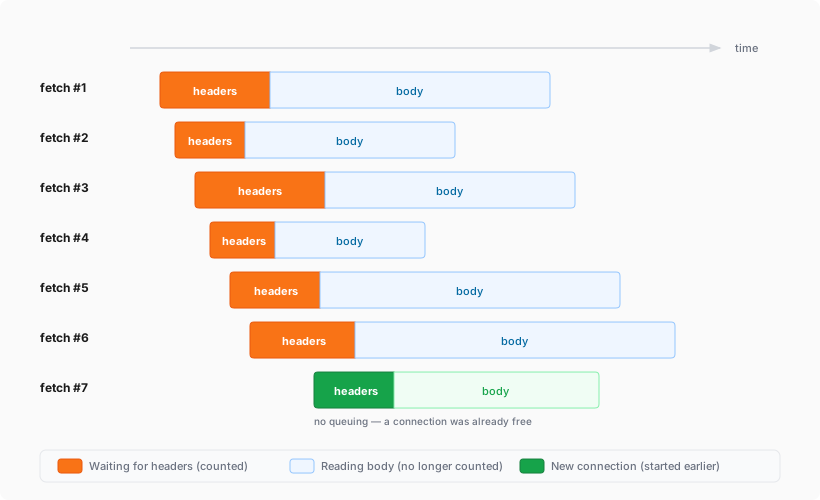
This means Workers can now have many more connections open at the same time without queueing, as long as no more than six are waiting for their initial response. This eliminates the
Response closed due to connection limitexception that could previously occur when the runtime canceled stalled connections to prevent deadlocks.Previously, the runtime used a deadlock avoidance algorithm that watched each open connection for I/O activity. If all six connections appeared idle — even momentarily — the runtime would cancel the least-recently-used connection to make room for new requests. In practice, this heuristic was fragile. For example, when a response used
Content-Encoding: gzip, the runtime's internal decompression created brief gaps between read and write operations. During these gaps, the connection appeared stalled despite being actively read by the Worker. If multiple connections hit these gaps at the same time, the runtime could spuriously cancel a connection that was working correctly. By only counting connections during the waiting-for-headers phase — where the runtime is fully in control and there is no ambiguity about whether the connection is active — this class of bug is eliminated entirely.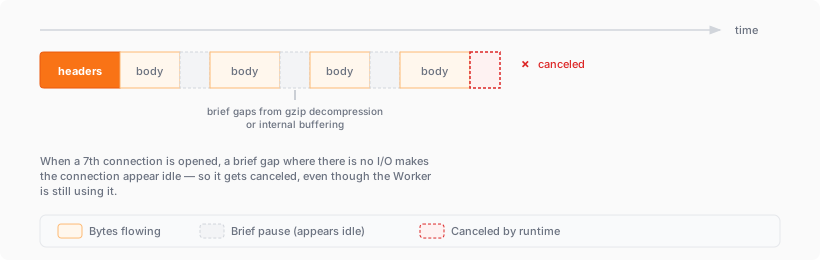
AI Search now supports CSS content selectors for website data sources. You can now define which parts of a crawled page are extracted and indexed by specifying CSS selectors paired with URL glob patterns.
Content selectors solve the problem of indexing only relevant content while ignoring navigation, sidebars, footers, and other boilerplate. When a page URL matches a glob pattern, only elements matching the corresponding CSS selector are extracted and converted to Markdown for indexing.
Configure content selectors via the dashboard or API:
Terminal window curl "https://api.cloudflare.com/client/v4/accounts/{account_id}/ai-search/instances" \-H "Authorization: Bearer {api_token}" \-H "Content-Type: application/json" \-d '{"id": "my-ai-search","source": "https://example.com","type": "web-crawler","source_params": {"web_crawler": {"parse_options": {"content_selector": [{"path": "**/blog/**","selector": "article .post-body"}]}}}}'Selectors are evaluated in order, and the first matching pattern wins. You can define up to 10 content selector entries per instance.
For configuration details and examples, refer to the content selectors documentation.
AI Search now supports four additional Workers AI models across text generation and embedding.
Model Context window (tokens) @cf/zai-org/glm-4.7-flash131,072 @cf/qwen/qwen3-30b-a3b-fp832,000 GLM-4.7-Flash is a lightweight model from Zhipu AI with a 131,072 token context window, suitable for long-document summarization and retrieval tasks. Qwen3-30B-A3B is a mixture-of-experts model from Alibaba that activates only 3 billion parameters per forward pass, keeping inference fast while maintaining strong response quality.
Model Vector dims Input tokens Metric @cf/qwen/qwen3-embedding-0.6b1,024 4,096 cosine @cf/google/embeddinggemma-300m768 512 cosine Qwen3-Embedding-0.6B supports up to 4,096 input tokens, making it a good fit for indexing longer text chunks. EmbeddingGemma-300M from Google produces 768-dimension vectors and is optimized for low-latency embedding workloads.
All four models are available without additional provider keys since they run on Workers AI. Select them when creating or updating an AI Search instance in the dashboard or through the API.
For the full list of supported models, refer to Supported models.
Cloudflare One's User Risk Scoring now incorporates direct signals from Gateway DNS traffic patterns. This update allows security teams to automatically elevate a user's risk score when they visit high-risk or malicious domains, providing a more holistic view of internal threats.
Browsing activity is a primary indicator of potential compromise. By tying Gateway DNS logs to specific users, administrators can now flag individuals interacting with:
- Security threats: Domains associated with malware, phishing, or command-and-control (C2) centers.
- High-risk content: Categories such as questionable content or violence that may violate corporate compliance.
Even if a Gateway policy is set to Block the traffic, the interaction is still captured as a "hit" to ensure the user's risk profile reflects the attempted activity.
Two new behaviors are now available in the dashboard:
- Suspicious Security Domain Visited: Triggers when a user visits a domain in the security threats or security risk categories.
- High risk domain visited: Triggers when a user visits domains categorized as questionable content, violence, or CIPA.
To learn more and get started, refer to the User Risk Scoring documentation.
You can now automate your threat monitoring by setting up custom alerts in your saved views. Instead of manually checking the dashboard for updates, you can subscribe to notifications that trigger whenever new data matches your specific filter sets, like new activity associated to a particular threat actor or spikes in activity within your industry.
By linking your saved views to the Cloudflare Notifications Center, you can ensure the right information reaches your team at the right time.
-
Immediate Alerts: receive real-time notifications the moment a critical event is detected that matches your saved criteria. This is essential for high-priority monitoring, such as tracking active campaigns from specific APT groups.
-
Daily Digests: opt for a summarized report delivered once a day. This is ideal for maintaining situational awareness of broader trends, like regional activity shifts or industry-wide threat landscapes, without cluttering your inbox.
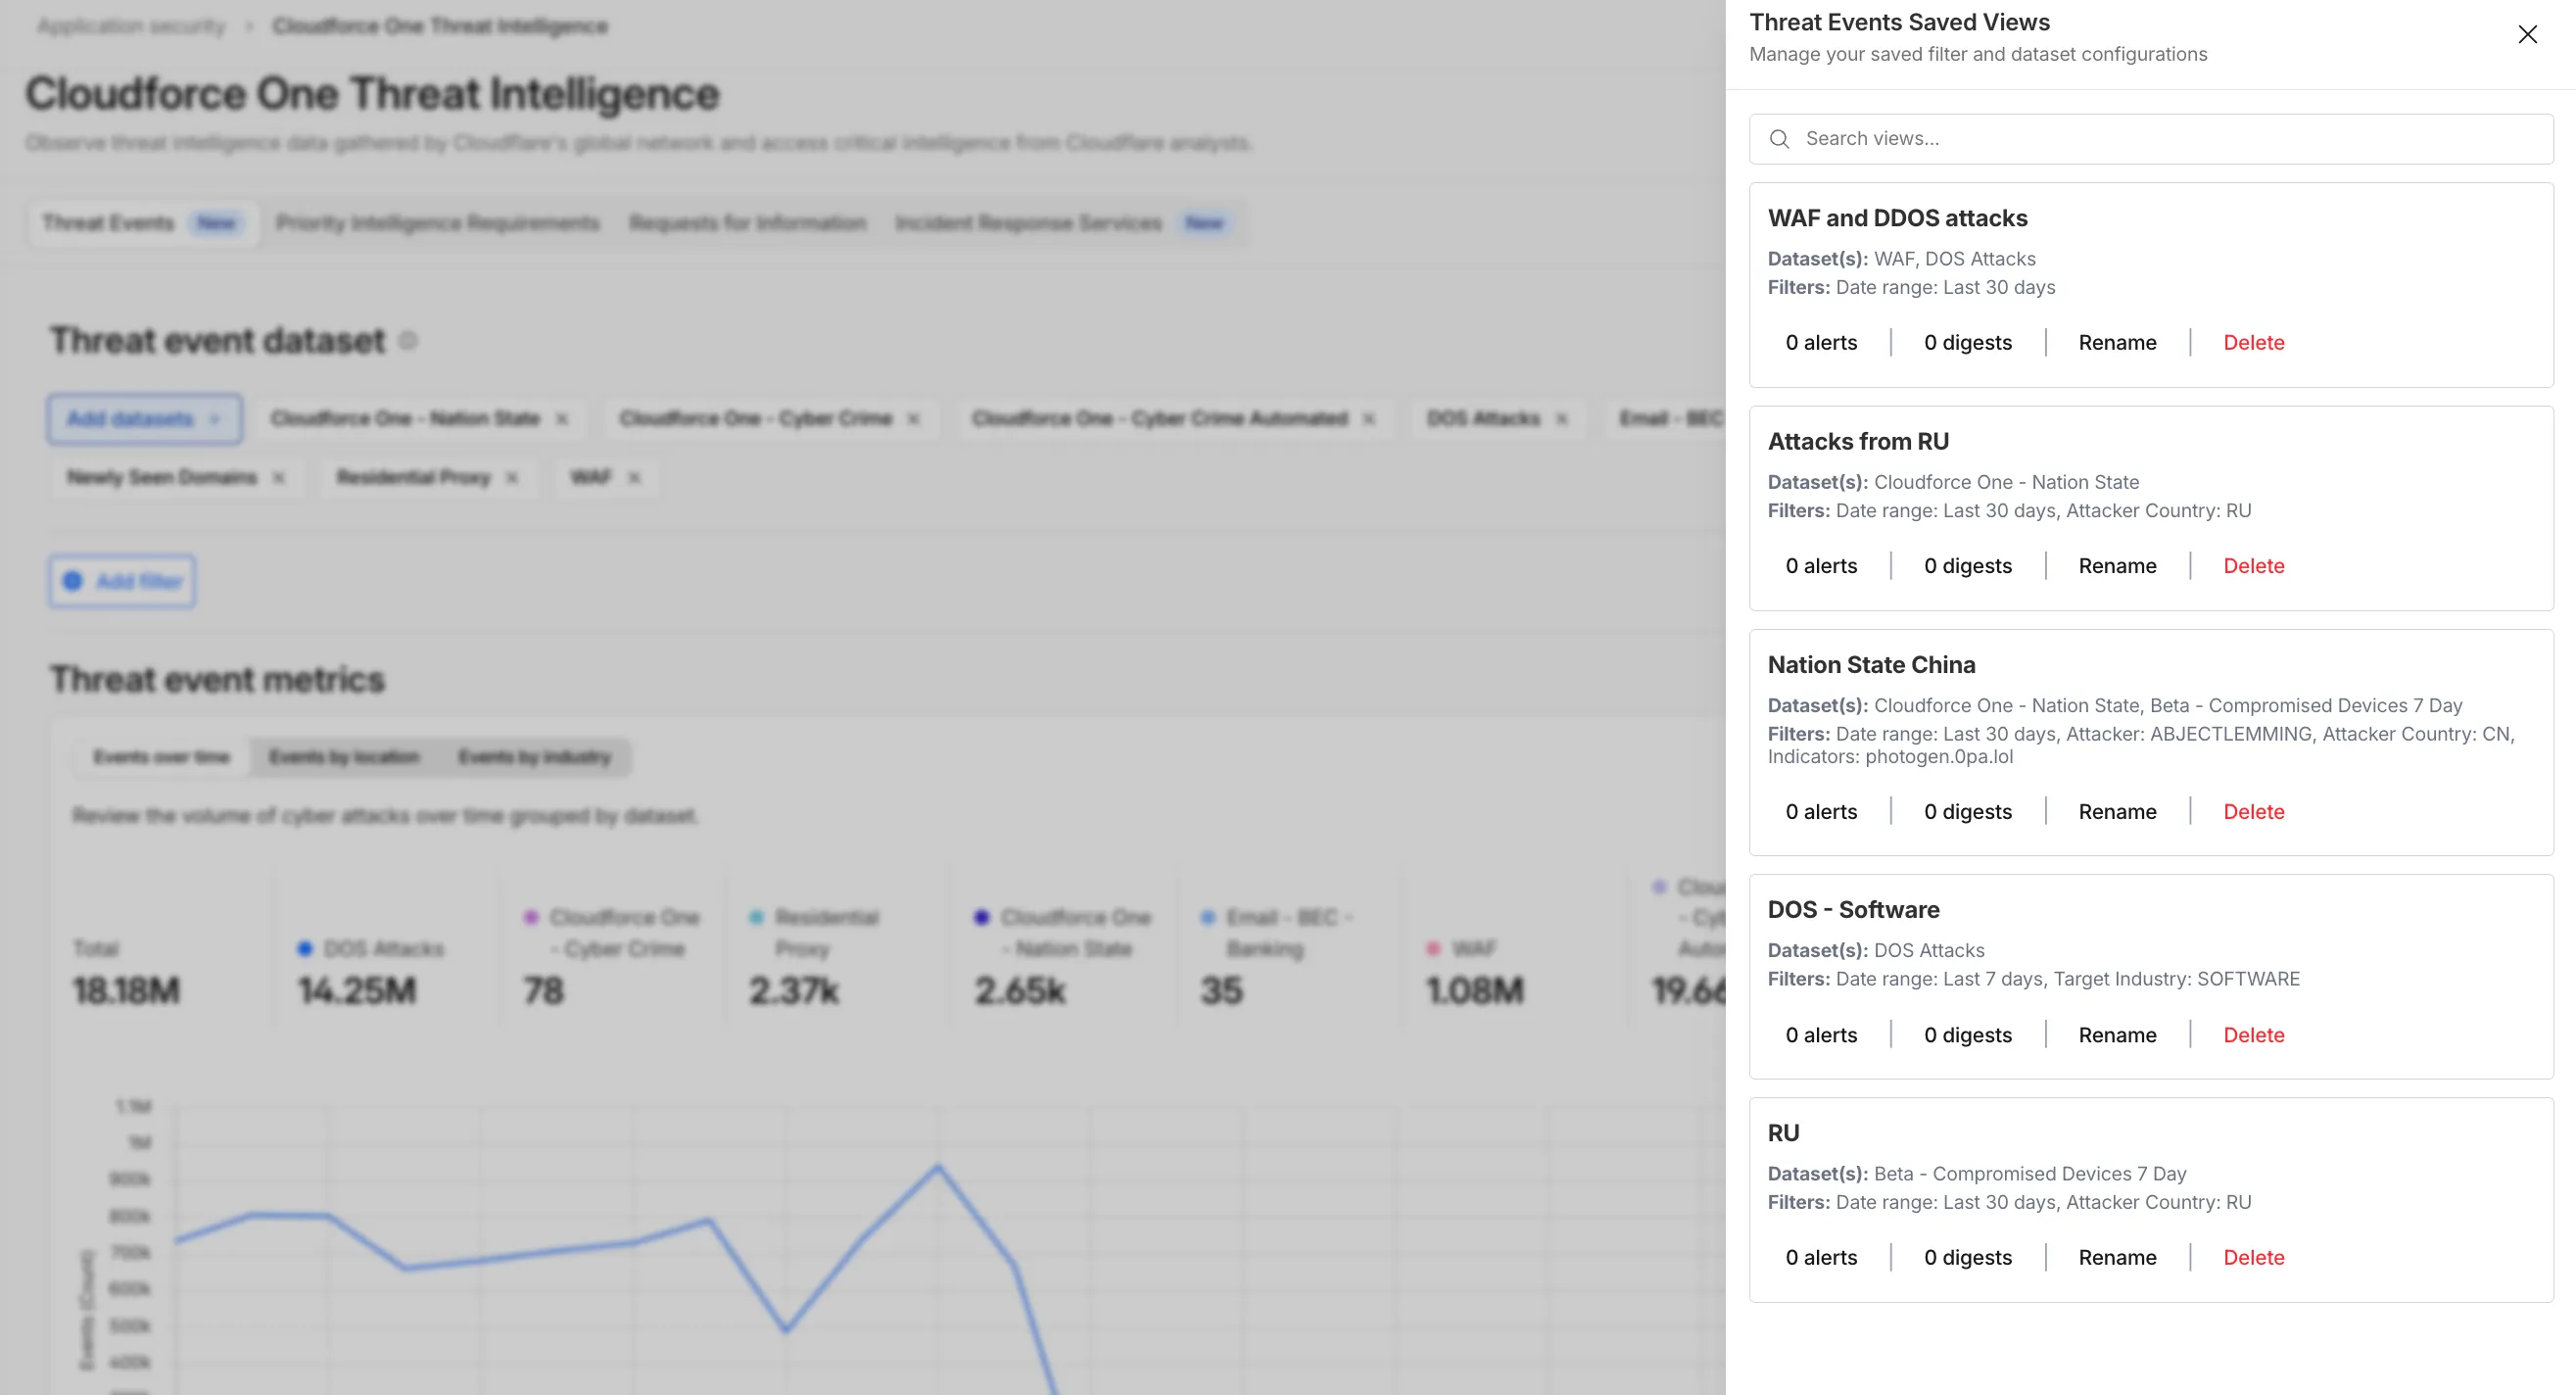
To set up an alert, go to Application Security > Threat Intelligence > Threat Events. From there:
- Choose your datasets and apply your desired filters and select Save View (or select an existing one).
- Open the Manage Saved Views menu.
- Select Add Alert next to your chosen view to configure your notification preferences in the Cloudflare dashboard.
For more technical details on configuring notifications, refer to the Threat Events documentation.
-
A new GA release for the Windows Cloudflare One Client is now available on the stable releases downloads page.
This release contains minor fixes and improvements.
The next stable release for Windows will introduce the new Cloudflare One Client UI, providing a cleaner and more intuitive design as well as easier access to common actions and information.
Changes and improvements
- Fixed an issue causing Windows client tunnel interface initialization failure which prevented clients from establishing a tunnel for connection.
- Consumer-only CLI commands are now clearly distinguished from Zero Trust commands.
- Added detailed QUIC connection metrics to diagnostic logs for better troubleshooting.
- Added monitoring for tunnel statistics collection timeouts.
- Switched tunnel congestion control algorithm for local proxy mode to Cubic for improved reliability across platforms.
- Fixed packet capture failing on tunnel interface when the tunnel interface is renamed by SCCM VPN boundary support.
- Fixed unnecessary registration deletion caused by RDP connections in multi-user mode.
- Fixed increased tunnel interface start-up time due to a race between duplicate address detection (DAD) and disabling NetBT.
- Fixed tunnel failing to connect when the system DNS search list contains unexpected characters.
- Empty MDM files are now rejected instead of being incorrectly accepted as a single MDM config.
- Fixed an issue in local proxy mode where the client could become unresponsive due to upstream connection timeouts.
- Fixed an issue where the emergency disconnect status of a prior organization persisted after a switch to a different organization.
- Fixed initiating managed network detections checks when no network is available, which caused device profile flapping.
- Fixed an issue where degraded Windows Management Instrumentation (WMI) state could put the client in a failed connection state loop during initialization.
Known issues
For Windows 11 24H2 users, Microsoft has confirmed a regression that may lead to performance issues like mouse lag, audio cracking, or other slowdowns. Cloudflare recommends users experiencing these issues upgrade to a minimum Windows 11 24H2 version KB5062553 or higher for resolution. This warning will be omitted from future release notes. This Windows update was released in July 2025.
Devices with KB5055523 installed may receive a warning about
Win32/ClickFix.ABAbeing present in the installer. To resolve this false positive, update Microsoft Security Intelligence to version 1.429.19.0 or later. This warning will be omitted from future release notes. This Microsoft Security Intelligence update was released in May 2025.DNS resolution may be broken when the following conditions are all true:
- The client is in Secure Web Gateway without DNS filtering (tunnel-only) mode.
- A custom DNS server address is configured on the primary network adapter.
- The custom DNS server address on the primary network adapter is changed while the client is connected.
To work around this issue, reconnect the client by selecting Disconnect and then Connect in the client user interface.
Cloudflare Email security now supports Triage Status Tracking for User Submissions. This enhancement gives SOC teams a streamlined way to track, manage, and prioritize user-submitted emails directly within the Cloudflare One dashboard.
- The User Submissions table now includes a Status column with three states: Unreviewed (new submissions awaiting triage), Reviewed (submissions assessed by the SOC team), and Escalated (submissions escalated to team submissions for further investigation). Analysts can quickly update statuses and filter the table to focus on what needs attention.
- SOC teams can now organize their triage workflows, avoid duplicate reviews, and make sure critical threats get escalated for deeper investigation—bringing order to the chaos of high-volume submission management.
Triage Status Tracking is automatically available for all Email security customers using the user submissions feature. No additional configuration is required; customers just need to make sure user submissions are being sent to their user submission aliases.
This applies to all Email security packages:
- Advantage
- Enterprise
- Enterprise + PhishGuard
Cloudflare One Appliance now supports Link Aggregation Control Protocol (LACP), allowing you to bundle up to six physical LAN ports into a single logical interface. Link aggregation increases available bandwidth and eliminates single points of failure on the LAN side of the appliance.
This feature is available in beta on physical appliance hardware with the latest OS. No entitlement is required.
To configure a Link Aggregation Group, refer to Configure link aggregation groups.
You can now manage mutual TLS (mTLS) and Bring Your Own Certificate Authority (BYO CA) configurations directly from the Cloudflare dashboard — no API required.
Previously, these advanced workflows required the Cloudflare API. The following are now available in the dashboard:
- AOP certificate management — Upload and manage your own certificate authorities for Authenticated Origin Pulls (AOP) directly from the dashboard.
- BYO Client mTLS certificate management — Upload and manage your own CA certificates for client mTLS enforcement without needing API access.
- CDN hostname to client mTLS certificate mapping — Associate client mTLS certificates with specific hostnames directly from the dashboard.
-
Cloudflare has officially launched a redesigned "Get Help" Support Portal to eliminate friction and get you to a resolution faster. Previously, navigating support meant clicking through multiple tiles, categorizing your own technical issues across 50+ conditional fields, and translating your problem into Cloudflare's internal taxonomy.
The new experience replaces that complexity with a personalized front door built around your specific account plan. Whether you are under a DDoS attack or have a simple billing question, the portal now presents a single, clean page that surfaces the direct paths available to you — such as "Ask AI", "Chat with a human", or "Community" — without the manual triage.
- One Page, Clear Choices: No more navigating a grid of overlapping categories. The portal now uses action cards tailored to your plan (Free, Pro, Business, or Enterprise), ensuring you only see the support channels you can actually use.
- A Radically Simpler Support Form: We've reduced the ticket submission process from four+ screens and 50+ fields to a single screen with five critical inputs. You describe the issue in your own words, and our backend handles the categorization.
- AI-Driven Triage: Using Cloudflare Workers AI ↗ and Vectorize ↗, the portal now automatically generates case subjects and predicts product categories.
Behind the scenes, we've moved the complexity from the user to our own developer stack. When you describe an issue, we use semantic embeddings to capture intent rather than just keywords.
By leveraging case-based reasoning, our system compares your request against millions of resolved cases to route your inquiry to the specialist best equipped to help. This ensures that while the front-end experience is simpler for you, the back-end routing is more accurate than ever.
To learn more, refer to the Support documentation or select Get Help directly in the Cloudflare Dashboard ↗.