
Changelog
New updates and improvements at Cloudflare.

Cloudflare Web Analytics (Real User Monitoring) has rolled out performance optimizations to significantly improve the stability and loading speed of account-wide dashboards.
For larger accounts (with >100 Web Analytics sites), loading the aggregate account-wide view would often fail, running into timeouts or unexpected interface errors due to the massive scale of parallel query processing. This update optimizes how high-volume multi-site data is queried to reduce errors and provide a snappier dashboard experience.
Accounts with up to 1,000 sites will now be able to load this account-wide aggregate view without experiencing misleading errors.
If you have an account with over 1,000 sites, we cannot currently aggregate over this volume due to processing constraints but you will now be presented with a clear error and instruction to filter to the relevant site(s) you wish to see the data for.
The
/cdn-cgi/rumbeacon endpoint now returns405 Method Not Allowedfor non-POST requests instead of404 Not Found. The response includes anAllow: POST, OPTIONSheader per RFC 9110 §15.5.6 ↗.Previously, sending a
GETor other non-POST request to this endpoint returned a404, which was misleading because it suggested the endpoint did not exist. The new405response clearly indicates that the endpoint exists but only acceptsPOSTrequests.The Web Analytics beacon (
beacon.min.js) already usesPOSTfor all metric submissions, so this change does not affect normal beacon operation.OPTIONSrequests for CORS preflight continue to work as before.For more information, refer to the Web Analytics FAQ.
Cloudflare Web Analytics now supports Navigation Type reporting and filtering.
This update allows developers and performance analysts to see how users are navigating between pages — whether through a link click or form submission, a page reload, or using the browser's back/forward buttons — and whether a browser cache hit occurred for these behaviors.
Understanding navigation types is critical for optimizing user experience. For example, if a high volume of your traffic consists of "Back-forward" navigations versus "Back-forward Cache", those visitors are not benefiting from the Back/Forward Cache (bfcache) and therefore are experiencing higher load times due to potentially unnecessary network requests.
The same applies for regular "Navigate" entries — where "Navigate Cache", "Navigate Prefetch Cache" and "Prerender" would provide instant document retrieval — and "Reload", where "Reload cache" would be more optimal.
A high volume of "Reload" entries can also indicate a potential stability problem with your website.
By identifying these patterns, you can tune your browser caching strategies to ensure HTML documents are served instantaneously from local caches rather than requiring a roundtrip to the network.
For more information, refer to Navigation Types.
- Monitor Cache Effectiveness: See how often your site is served from the HTTP cache or bfcache.
- Identify Performance Bottlenecks: Filter by the different types to understand performance opportunity of improving browser cache hit ratio.
You can now find the Navigation Type dimension in the Web Analytics dashboard. You can filter to include/exclude one or more specific types using "equals", "does not equal", "in", or "not in" matchers.
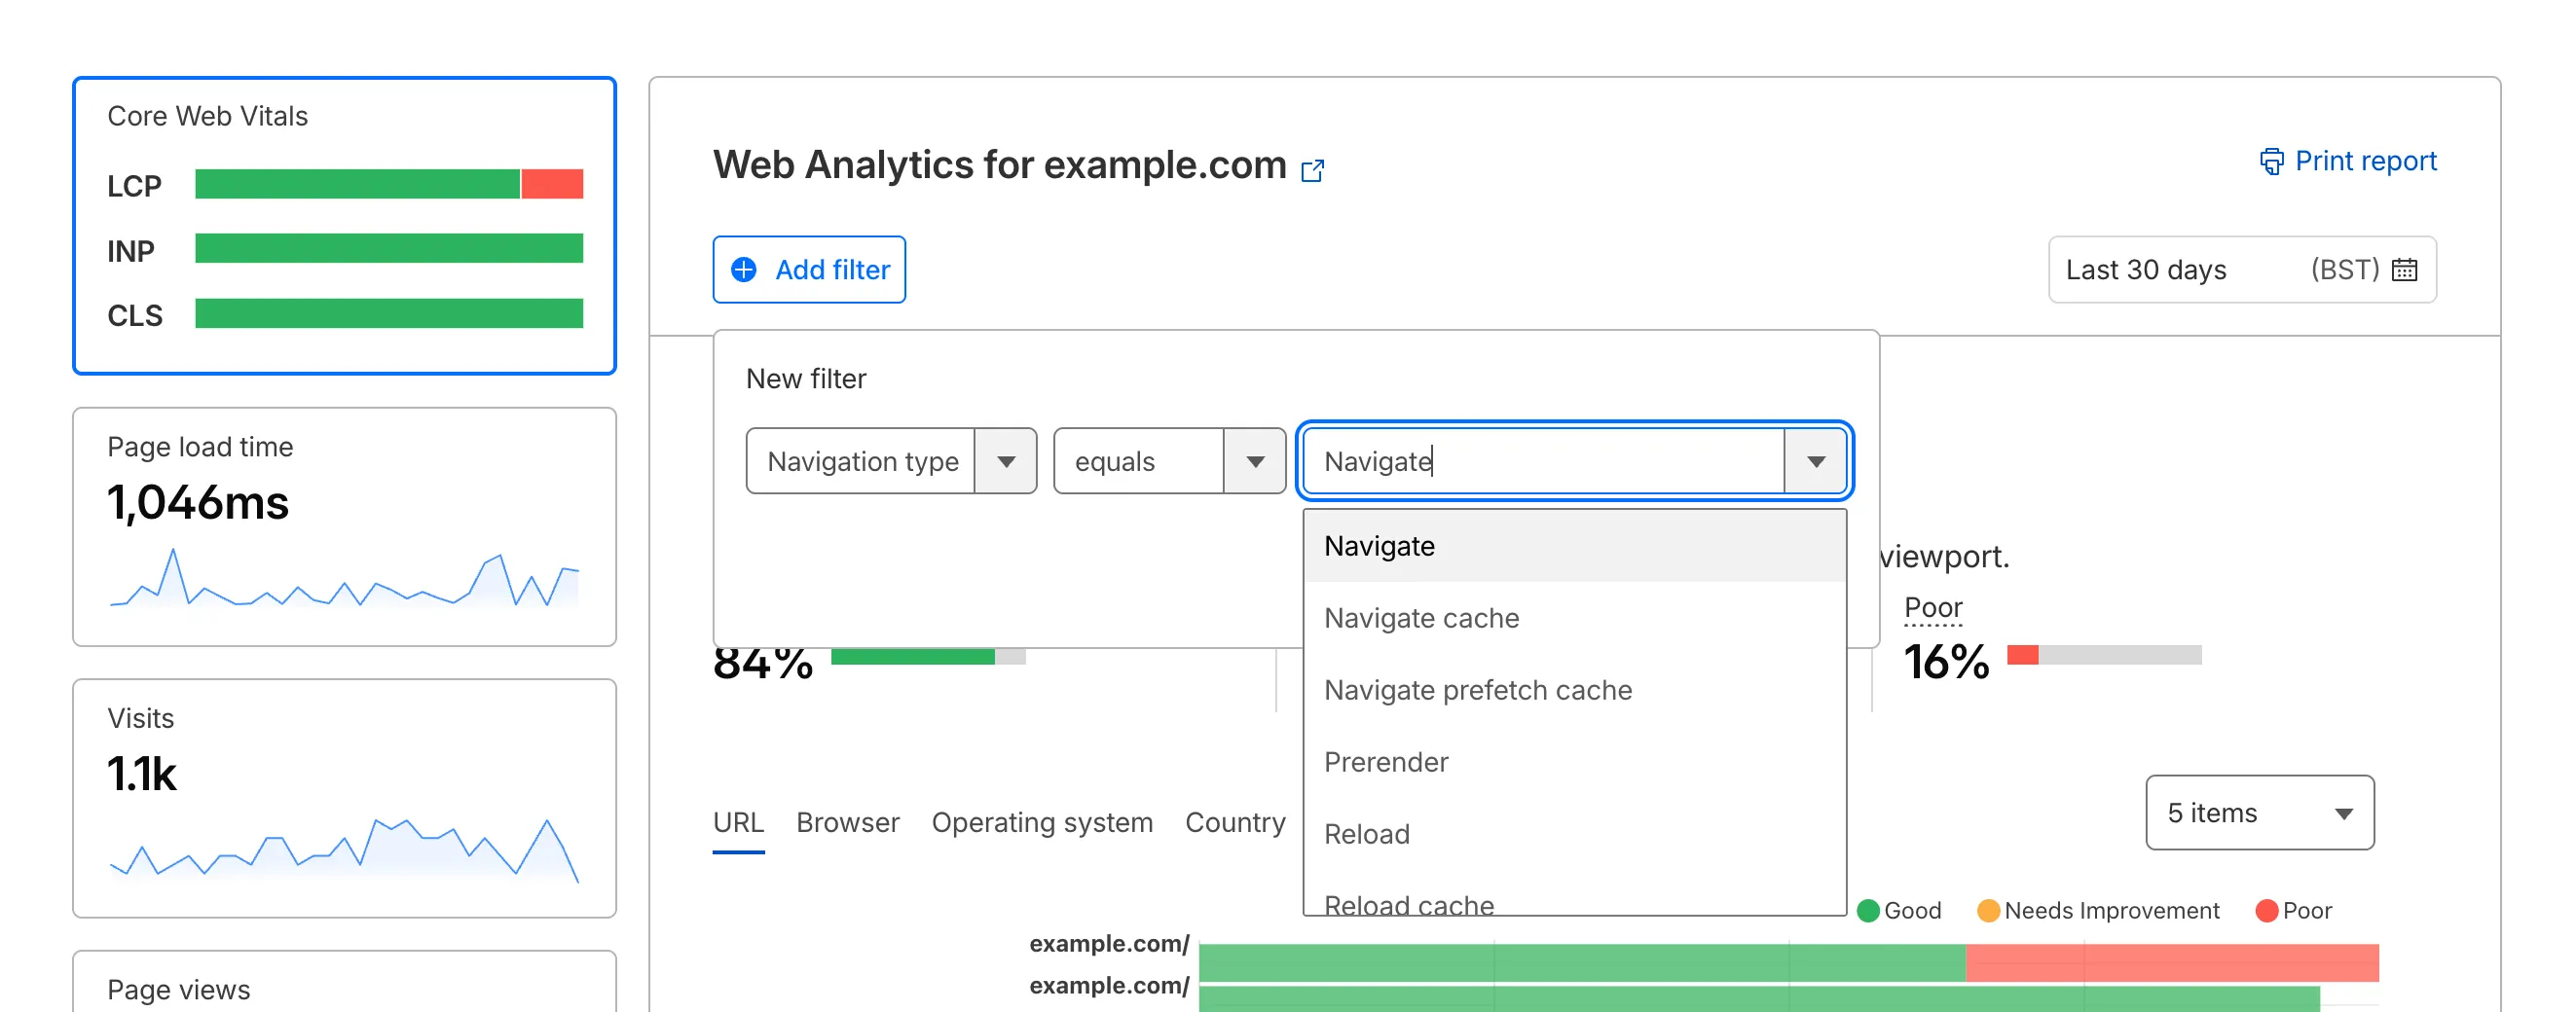
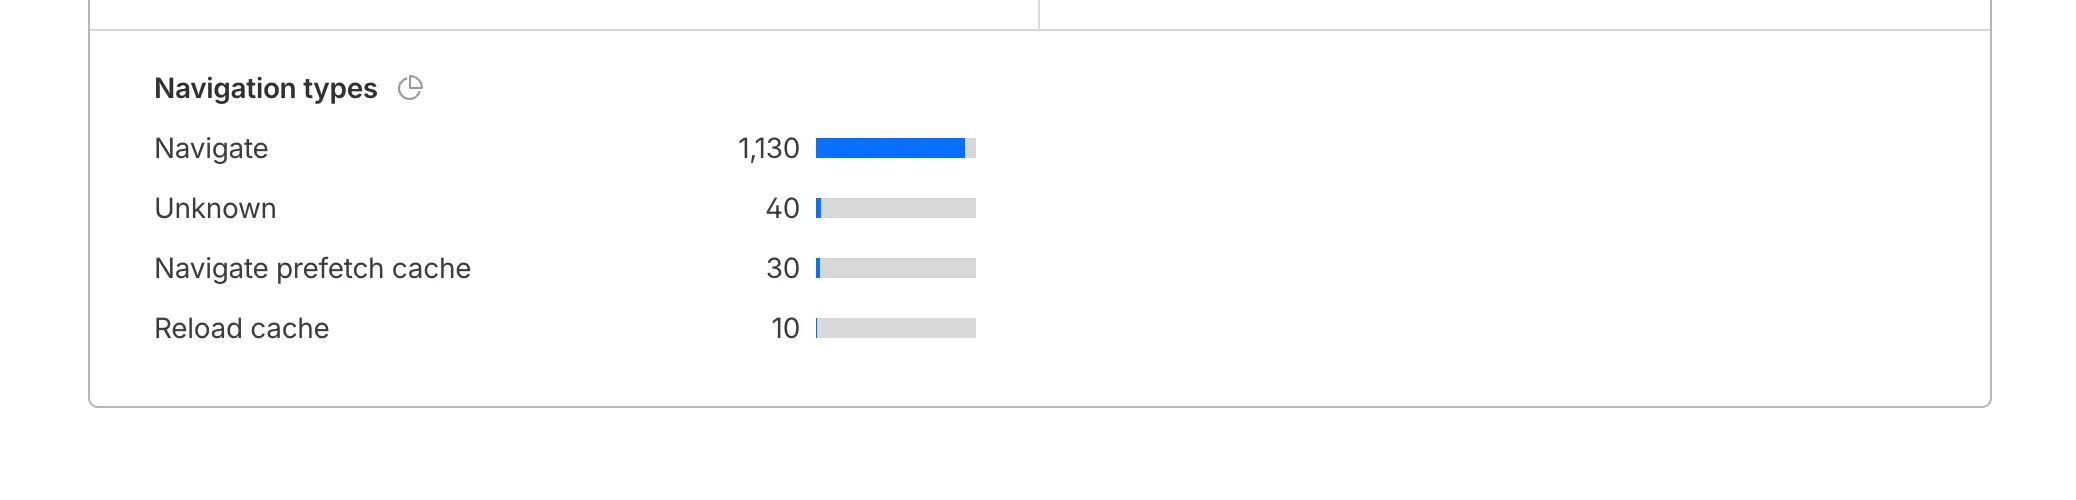
To check the list of popular navigation types, select Page views on the Web Analytics sidebar and scroll down to the bottom:
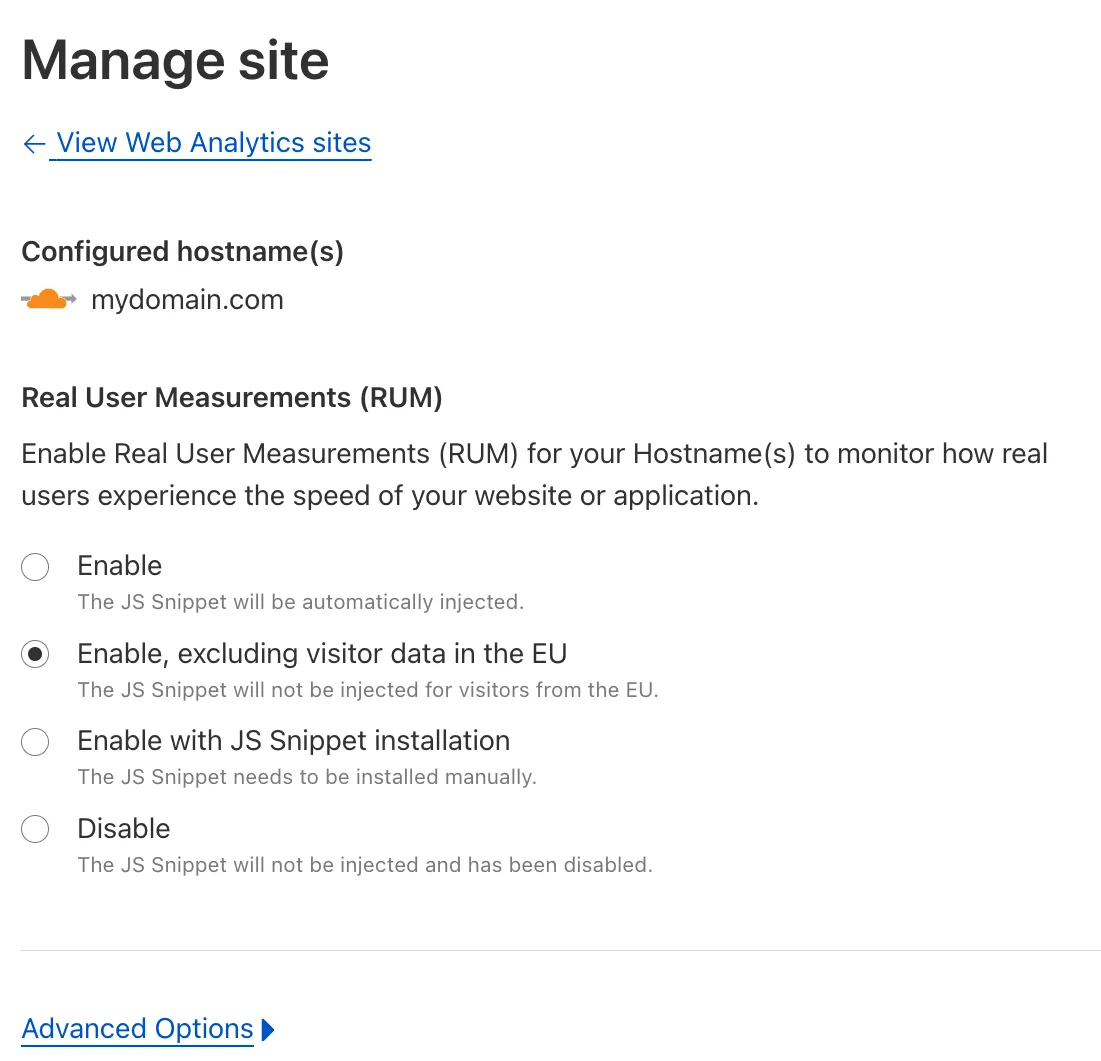
You can now easily enable Real User Monitoring (RUM) monitoring for your hostnames, while safely dropping requests from visitors in the European Union to comply with GDPR and CCPA.
Our Web Analytics product has always been centered on giving you insights into your users' experience that you need to provide the best quality experience, without sacrificing user privacy in the process.
To help with that aim, you can now selectively enable RUM monitoring for your hostname and exclude EU visitor data in a single click. If you opt for this option, we will drop all metrics collected by our EU data centers automatically.
You can learn more about what metrics are reported by Web Analytics and how it is collected in the Web Analytics documentation. You can enable Web Analytics on any hostname by going to the Web Analytics ↗ section of the dashboard, selecting "Manage Site" for the hostname you want to monitor, and choosing the appropriate enablement option.